NewLaunch price: the first ten sites get the Site Evidence Pack at £3,600. Check whether your site qualifiesLaunch offer: £3,600 a site. Check yours
Vireo Nature
How it works

Remote sensing, from orbit to a figure you can check.

Remote sensing and earth observation turned into site evidence you can check: satellites, terrain, the river network and your own measurements, read as one connected system for land, water, habitat and carbon.

How it reads a site

Five steps from remote sensing to site check.

01 · OBSERVE

Satellites see the surface

Optical imagery, radar and terrain cover every hectare, every pass. They show the surface. The Neural Map reads what lies beneath it.

02 · SHAPE

Terrain shapes the water

Elevation tells the model where water gathers, where peat and wetland form, and where nutrients and sediment drain away.

03 · CONNECT

Everything is connected

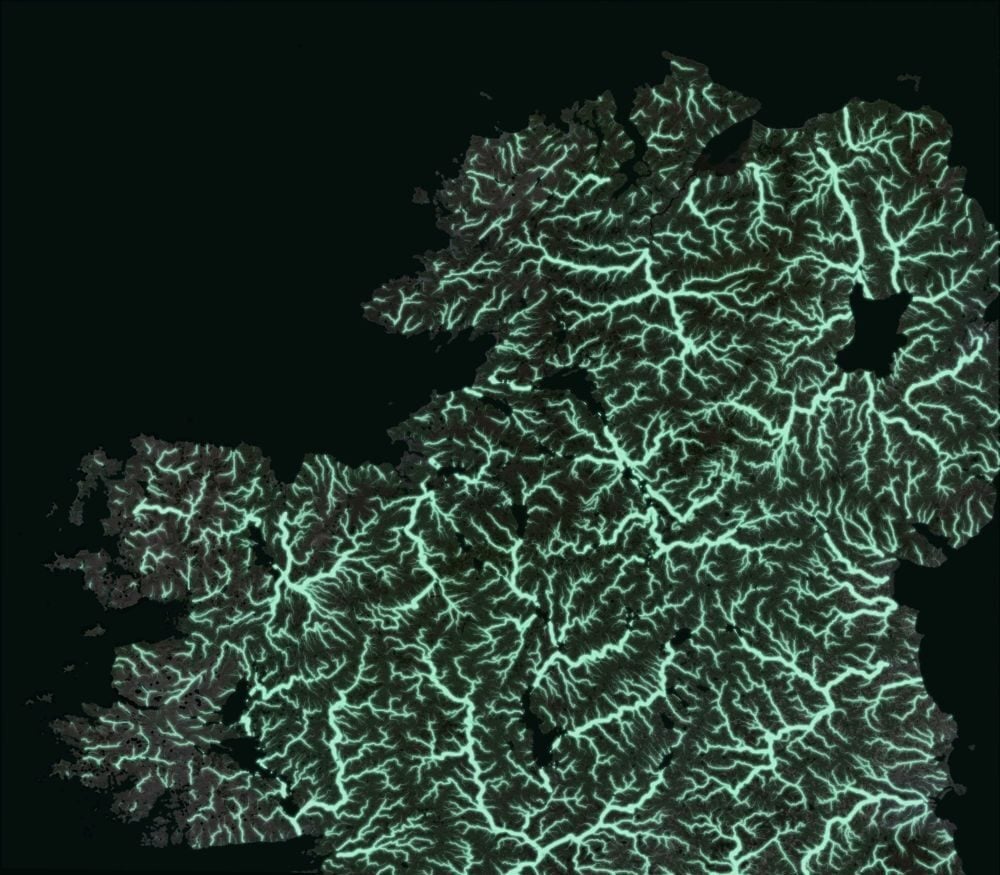
The Neural Map traces how each place links to the land around it: the stream network, the catchment and the nearest measured hubs.

04 · GROUND

Ground measurements correct it

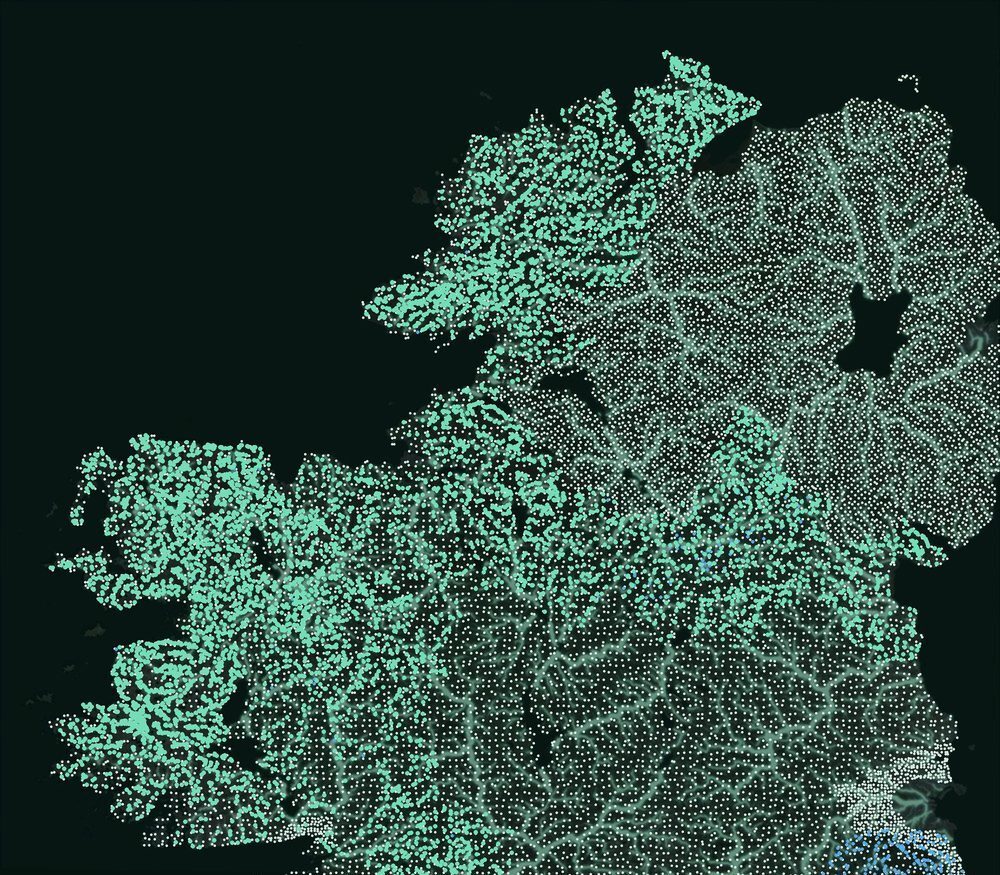
Probes, loggers and survey sites anchor the model. Each new measurement corrects the physics where it is taken.

05 · ANSWER

A figure with its range and its record

Out comes the reading, its range, its source and how it was tested. Vireo never guesses: where the evidence cannot support a number, the read says so and states why.
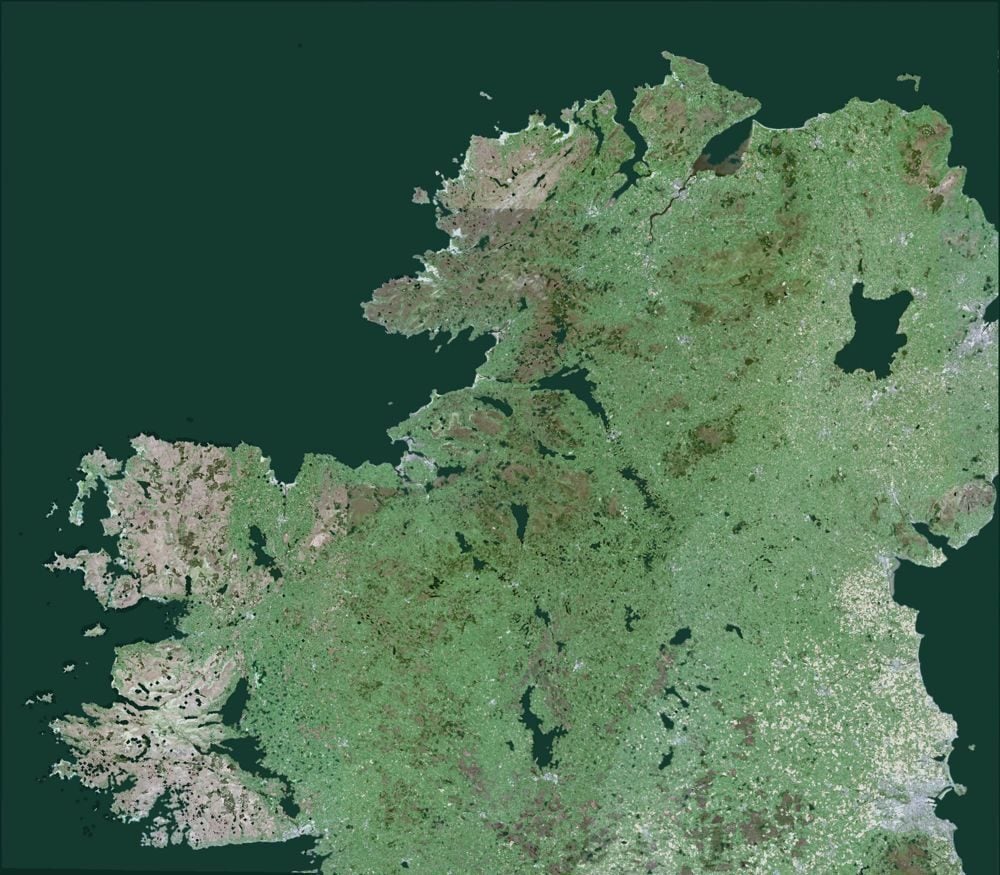
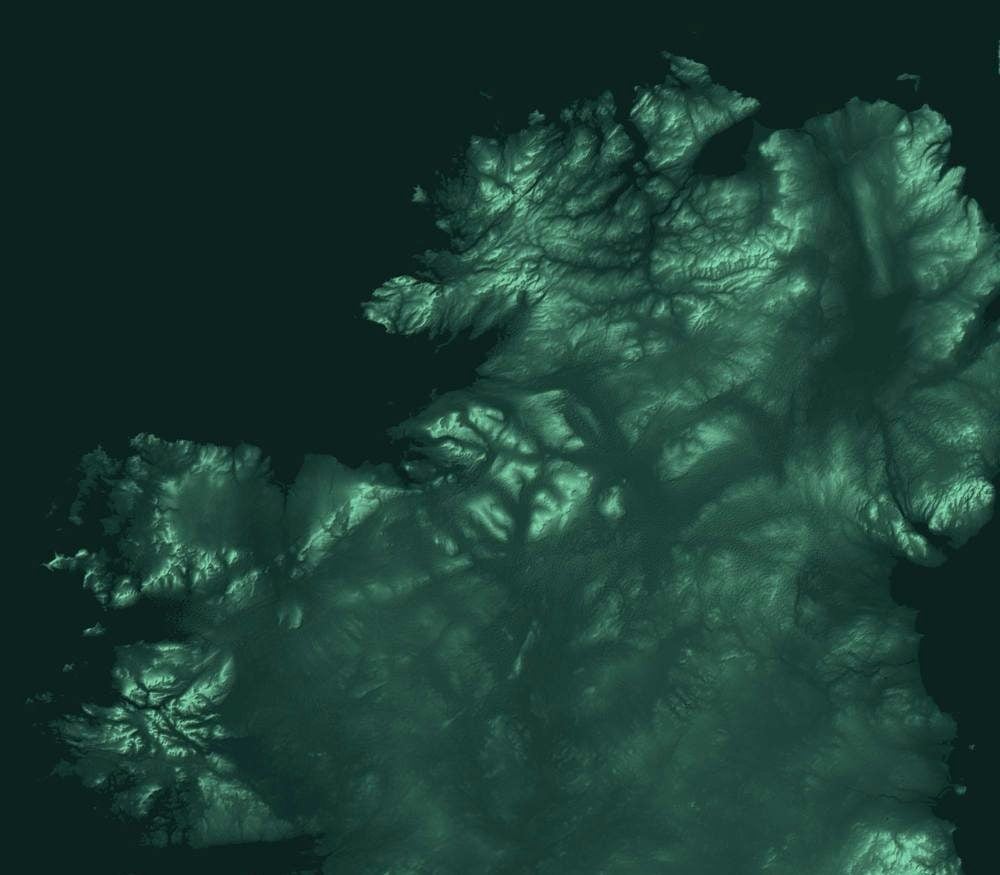
Remote sensing: a Sentinel-2 summer median satellite image of the north of Ireland Terrain relief from the Copernicus DEM Stream network traced from terrain, glowing over the imagery Measured stream water, sediment and topsoil sites over the network
Example output
0.36 → 0.64
Skill on 870 unseen stream sites, before and after connected data
TierSealed
Declared6 Oct 2026, 08:04 UTC
Held back870 sites in 40 blocks
ScoredOnce
Every figure names its evidence. Where the evidence cannot support one, the read says why, never a guess.
Real layers: Copernicus Sentinel-2 and DEM (modified), Tellus survey site positions; north of Ireland.
Inside the Vireo Neural Map

Britain and Ireland, read from national scale to the field.

~250,000peat depth records, each readable from national scale to field
748measured hubs in the learning graph
1,641learned links between hubs
15,350Irish river lines on the same frame
583Irish sub-catchments
3,111Irish monitoring stations

Every place is read with what surrounds it, not in isolation.

Every place is read with the land around it: terrain, soil, water, the river network and the nearest measured hubs. On every paired measure we have tested, the node model beats the point model.

Peat is where the method was proved first, because it is where carbon concentrates and where survey methods under-read it. The same engines now read water, wildfire and biodiversity, and every new domain is held to the same sealed standard.

The daily loop203,079

predictions rebuilt and reproduced identically every morning. Any improvement must beat the model of record on a fixed test before it replaces it, so the map only ever gets better.

Every figure carries its reading, its range, its source and its test.

That is what lets a consultant, a planning officer or a lender check a number without taking it on trust. See the results

Put the Neural Map to work on your boundary.

Three details. A reply within two working days.